
This data visualization is very aesthetically pleasing but unfortunately, that is the only positive attribute about it. Many questions arise as one attempts to demystify its message. What is it seeking to get across to its audience? Why aren’t all the individuals blue in the Facebook region if it is associated with the figure 100%? What is the difference between the blue and red colored individuals? What percentage is each of the eight individuals per line worth?
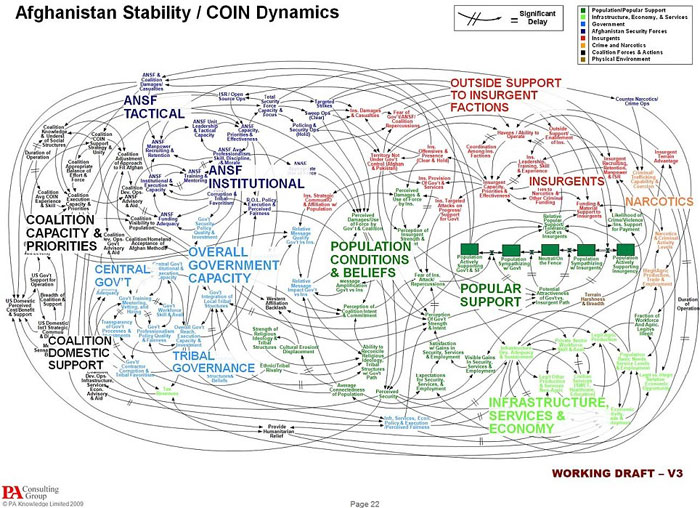
Before even delving into the visualization’s meaning, is very difficult to look at. One of the strongest traits of visualizations, in my opinion, is the ability to relay information in a clear, organized manner that allows the viewer to derive quick conclusions. However, this visualization embodies the exact opposite of that purpose. Though it is helpful for one to visualize how topics and subtopics connect, there is an overflow of information presented. The abundance of arrows and connections turns the viewer off instead of presenting a clearer form of the interconnectedness of information.
Leave a Reply