My corpus is constructed by articles about Chinese architectures about the time period from Qing dynasty to modern days. I want to compare the features, designs and meanings of the architectures from different times. I decide to use four time points as the basic boundary points to indicate the changing of architecture changes: Qing dynasty, the foundation of China, the Culture Revolution and nowadays. I searched the research papers from a website that clearly show the history of architecture in China and famous architects in the long time period http://www.chinahighlights.com/. Most of the articles in this website are summary of the researches and findings, so the conclusions made by these articles are useful for my goal to study the history of architecture of China.
The cirrus in Voyant explains a lot about Chinese architecture. The key words include “palace”, “imperial”, “garden”, and “building” can show the different types of architectures appeared in the history of Chinese architecture. Also, I can see the elements that affect the changing of architectures from the words “隆(one of the emperors in Qing dynasty)” “Manchu (the dominant nationality in a time period”, “culture”, and “western”. Words like “forbidden”, “traditional”, and “protection can also illustrate some of the functional usage of the architectures. Fusing with the knowledge that I have already known, the visualization results from Voyant can deepen my analysis of Chinese architectures. Chinese architectures have been keeping changed from long before to nowadays. During Qing dynasty, the architects are instructed by the imperial household and they learn from dragons to indicate the supremacy. As time goes on, architects began to search new ways to create architectures. They start to learn from western cultures, as long as keeping the traditional elements of China. Therefore, more buildings and gardens are built.

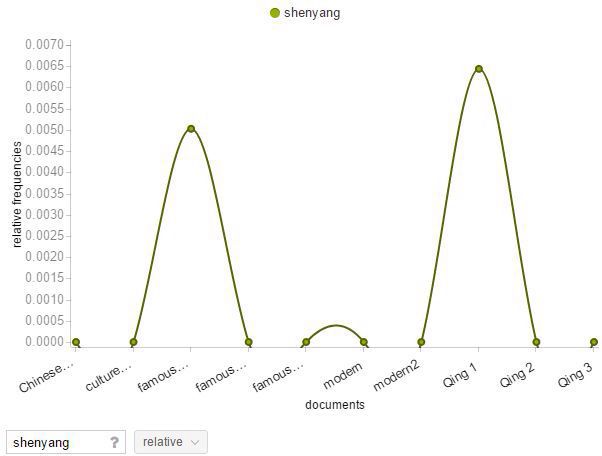
I also find another interesting and new phenomenon from Voyant. The locations of most famous Chinese architectures have been changing through the time period. During Ming and Qing dynasties, Shenyang is the city that has the largest number of well-known architectures. However, as long as China’s capital becomes Beijing and the economic level of Shanghai becomes the first of the country, more famous architectures were established in these two area.


I put the corpus I found into Jigsaw, but I found Jigsaw is not that useful as Voyant. My subject is to compare the architectures in different time periods, and the comparison is made from the four time points. I feel like Jigsaw can give more useful visualization about the changing process and time line influence about one object. However, I also find that using the document cluster view, with showing the most unique words on the screen, helps me to find the information I need immediately from related article. Also, the version of document view is really useful for me to look up the key words I need.


As I said previously, I found Voyant works better for my corpus and subject. It is easy and quick to abstract the most important elements from Voyant. But Jigsaw can do better on subjects related to time changing and comparisons of a continuous developing. I also feel like Jigsaw is more useful when creating some dynamic visualizations to help the readers to deepen their knowledge while playing around with Jigsaw. The most obvious difference of Jigsaw and Voyant can be that Voyant focuses more on the usage of words while jigsaw focuses more the concepts of articles. The best way to use these two tools can be using Voyant first to find the most important words in the corpus, and then put the words you find into the searching bar of Jigsaw to see why those words are key terms in concepts.
These two visualization platforms can absolutely create the visualizations with strong information based and visual sense influence. Every one of the visualizations is virtual, but all of them are constructed with real data information. The use of visualization platforms can turn the simplified data into a rich, attractive, but still rational visualizations.
Leave a Reply