I decided to use Donald Trump as the foundation of my corpus for this assignment. I did so by scraping text from the last 90 days of the most popular new articles about Trump (based on Google’s search rankings). This resulted in a diverse corpus of 16 articles consisting of recent events surrounding Donald Trump from major news outlets such as The New York Times, Politico, Business Insider, along with others. My decision to use Trump as a source of data was mostly based on the fact that he is a high-profile businessman and politician, with connections with many different individuals, organizations, and places (which will allow Jigsaw to identify these entities and connections). Additionally, the variety of news sources will allow for a comparison in wording across articles in Voyant as well as sentiment analysis in Jigsaw.
One program I u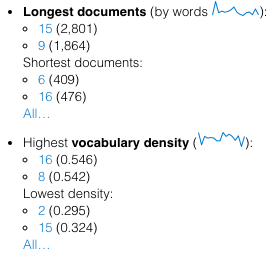 sed to analyze my corpus is Voyant Tools, which offers multiple visualizations for texts. It allows for a comprehensive view of the text, views of individual texts within the corpus, and even searches for specific keywords. One view I found useful for my corpus was the summary view, which allows you to get a macroscopic view of the texts. In particular, one statistic from the summary view that is interesting is vocabulary density, which is a way of quantifying the diversity of words in a text. In the case of my corpus, which consists entirely of news articles, the vocabulary density could speak to the article’s writing quality. For this corpus, the articles with the highest vocabulary density were written by NBC News and Politico, while the ones with the lowest density were written by Gawker and Business Insider. More specialized news sources such as Politico tend to have a higher vocabulary density, since they use more technical terms, while mainstream media outlets such as Gawker tend to have lower vocabulary density.
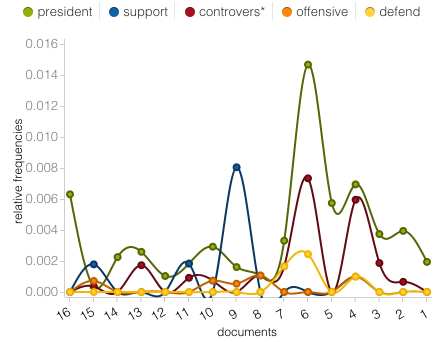
Another view that proved to be insightful for this corpus was the trends view. This view allows you to see the relative frequencies of keywords you provide across each text. The trend view showed some intriguing relationships between words. One example is that almost all of the articles describe Donald Trump as either offensive or controversial, but do not use both. This view can help reveal the type of political biases the authors may have based on how they describe the same events or individuals.
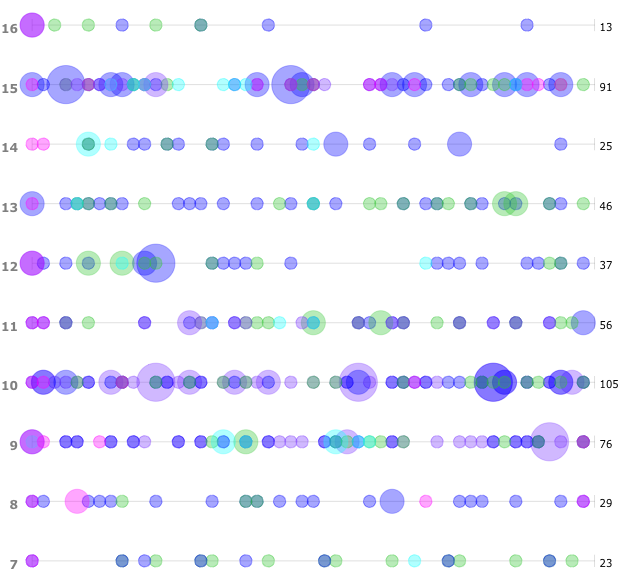 One visualization that could provide new insight is the Bubblelines view, which displays the use of certain words across each text by plotting bubbles on a line which relate to where the word was used in the text. For my corpus, however, I found the trends view to be more intuitive and insightful, since it provides the same data without showing where it appears in each text. In this case, it was easier to compare across a large number of texts using the trends view.
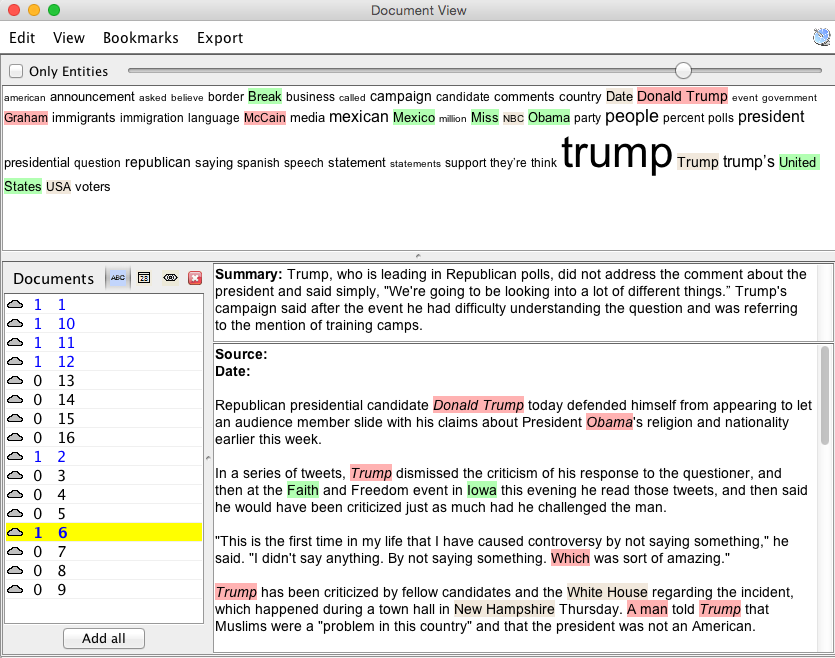 The other program I used to analyze this corpus is called Jigsaw. Jigsaw uses advanced algorithms to identify entities through the texts, such as people, locations, and organizations. It then uses the identifications it makes to find links between the entities, allowing the user to investigate their corpus using the multiple visualization tools that Jigsaw offers. The view in Jigsaw that I found to be central to my analysis was the Document View, which provides an overview to the texts in your corpus. It does so by displaying all of your documents along with a highly accurate, algorithmically generated summary sentence. This, along with the other elements in the Document View, make it a useful point of reference while analyzing the other views.
 Furthermore, the List View in Jigsaw provided many useful insights to my corpus. This view displays all the connections made between entities by drawing lines that link selected entity to other entities. For example, it was fascinating to see that Jigsaw accurately linked Jorge Ramos (a Mexican-American journalist) to organizations such as American Latinos, Univision, Azteca, and Telemondo, even though Ramos was only mentioned in two articles.
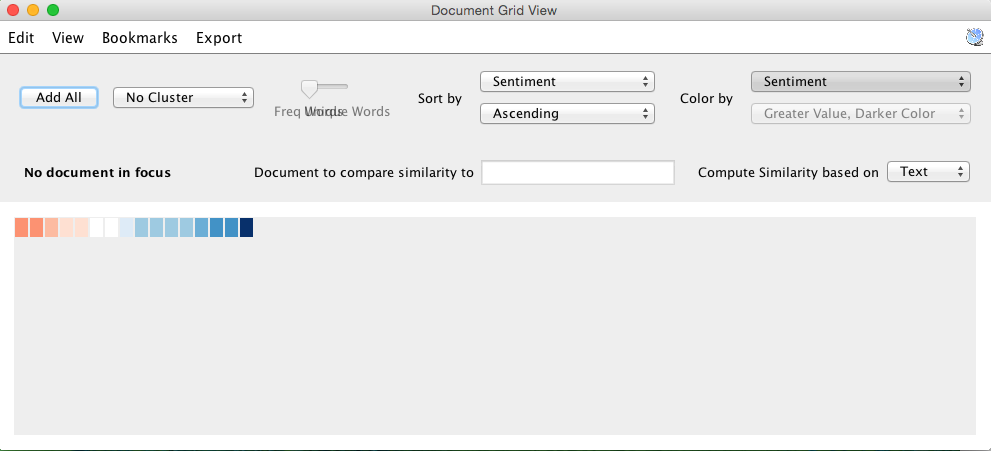 Another tool I found useful in Jigsaw was the Document Grid view, which I used to display the sentiment analysis data from each article. This view made it easy to find the articles that berated Trump and his actions, the ones that were neutral, and the ones that supported him. This view also offers other sorting mechanism such as sorting by number of entities in the document or subjectivity (which I did not find to be as accurate as the sentiment analysis).
Both Jigsaw and Voyant provide useful insight to textual data, but in different ways. Jigsaw, with its entity identification and advanced textual analysis, is useful for investigative inquiries. Jigsaw’s ability to view multiple tools at once allow you to start at one entity, or group of entities, and find how it is linked to another entity. This has made Jigsaw very helpful for law enforcement, who can use the tool to analyze hundreds of documents at a time along with Jigsaw’s many tools simultaneously to find the information they need in an investigation.
Voyant, on the other hand, provides textual analysis from a high-level view of the documents. It does so by mostly comparing words that appear within the document instead of attempting to analyze the text. While Voyant is capable of providing interesting results, it is up to the user to provide the right search parameters to find interesting patterns in the corpus.
What I learned from this experience is that it is impossible to gain a holistic view of a corpus using just one tool. On the one hand, we gain great insight by using tools such as Voyant and Jigsaw to see statistics and connections that would have been very difficult to compute by hand. On the other hand, it is important to realize that all the analysis we look at are abstractions and simplifications of the real information. Behind each of these visualizations is an algorithm and various design decisions. The visualizations we see come with the biases of the designer or developer and so we might unknowingly be looking the data the way they intended us to see it, not they way it was intended to be seen. Therefore, while digital tools can provide great insight to text, it is important to take the analysis with a grain of salt, and even verify a result using multiple tools.
Leave a Reply