Data Preparation (Zhengri)
Network Visualisations start with questoins.(Lima) So we start this project from our previous visualisation on RPG game’s topic. Our question is “Is our previous observation true in actual cases?” Therefore, we take the official novel (official story text) of World of Warcraft to help us answer this question. The book is named as War of the Ancients Trilogy. We create two datasets from the text: 1. the relationship between characters 2. the character’s identity. The first step is to find characters from the text, so we use the tool jigsaw to extract person name from the text. Then we use algorithms to build a relationship table. For the character identity table, we build a data scheme of Gender, Name, Affiliation and Race. We do this because our question is to explore our previous prediction’s influence in an actual case. Our previous prediction is mainly on gender of characters and the affiliation of characters in RPG games. I won’t talk about the data preparation in detail because it is mainly my colleagues work. If you would like to explore more about this pls visit his blog post. The data preparation should count as very important in our project because it is the most important basis.
Data Analysis w/ Gephi (Jiayu)
I got the list of character’s relationship from Albert(my teammate) then I start to use gephi to visualize the graph data. Though Gephi has been updated since my first use last year, It can not support space between text. Therefore, before inputing the name data into Gephi to create relational graph, I eliminate space first using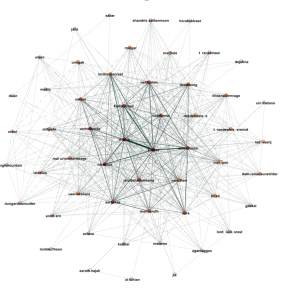 the code =SUBSTITUDE(row, ” “, “_”) in excel (I mention this because it might be really heapful for the future gephi user.) After I input my data into Gephi, the output is like the graph on the left. (Well, it is not quite exactly the same, but the “DEGREE OF MEANINGLESS” matches.) It looks pretty but it reveals nothing. Though we can make the strong relationships look more significant and the influential nodes’ color darker, it tells nothing. Next step following our relational creation is to identify the identity on each node. Therefore, we combine the information in our identity list and our relational graph. each node in our dataset involved with its gender, affiliation and race. We choose those attributes to build our node identity scheme because we would like to continue our previous project on RPG games, which reveals the gender facts and affiliation fact. Gephi’s data managment feature works very well because it is able to do a natural join on two data set (It combine relations with the node’s attributes even if they are two separate dataset, the key(id) we use to do that is the name). So our futher analysis on this WOW character data is on 1. the gender 2. the affiliation 3. the race
Gender Analysis on WOW Data:

On the right is a character relation graph with partition coloring based on gender. The green color stands for male and red color stands for female. The blue one (yes, they do exist) is those in unknown gender (animals or just unknown type). The pattern is, well, very straight forward yet predictable. Male is dominating RPG game and story. Though there are still some red points with strong connections, It won’t change the fact that we don’t really need a female figure. Even if it is the most famous and legacy RPG game World of Warcraft. This pattern can be more 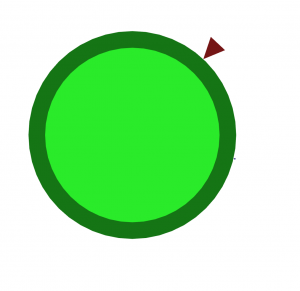 shocking if we do a group to the data. (the graph on the right) The big green dot is of course the male character group and the poor unknown group are the small dot on the 4 clock direction (if you can not notice it at the first glance haha. you may read the post on the high definition webpage to find it.). The exploration on WOW proves our previous observation very well.
Affiliation Analysis on Gephi:
Another observation on our previous data analysis on RPG games are that the affiliation of bad guys, the villains, act as more important roles in RPG games. However, the graph tends to tell a different story for World of Warcraft. On the left is a visualization of the affiliation grouped graph. Red Color is the good guys and black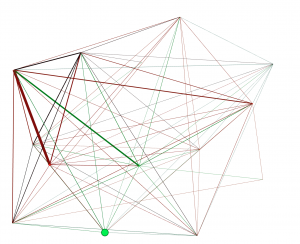 tends to be the villain and green color is those characters that on the neutral side. Connections between those red points totally shut down our previous prediction on the affiliation influence towards RPG game. When we explore more on the most significant points (the big green(neutral side)), we find something interesting that may explain the mis-prediction. The neutral side characters, even if they tends to act neutral, didn’t have much connections with the villains. Then, the connections between villains and heroes are always very strong (the widest red line). And there is only few connections between different villains. So we can find a story behind this affiliation relationship. That because neutral characters have no connections with villains, we can say that they are more like “background NPC” instead of core characters. They don’t actually involve in the conflict and they are mentioned because the protagonist meet them. Then because the connections between villains are really weak, we can conclude they are truly THE VILLAIN. They are very strong and they are strong enough to conflict with the heroes without much cooperation. Then the strong connection between heroes and villain might lead to the fact on massive conflict or main story line. Then we can conclude, villains in our story are not the first glance in the graph, not important. They are just depicted as lonely villains. The strong connections between villains and heroes proves their importances. However, I would like to say that the villain’s figure is so cliche in World of Warcraft. It is just a very traditional Byronic Hero.
Race Analysis on Gephi:
The third analysis on Gephi we built is the partition based on race. I would like to prove my previous analysis on affiliation with my race analysis. That the relationship strength reveals the node’s level/status in the story and the size of the node reve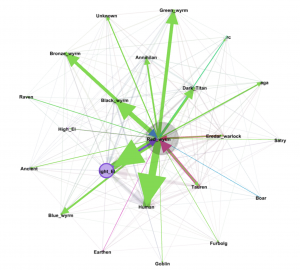 als the node’s level of loneliness. This graph shows that in WOW novel, the race with most characters is night elf the big purple node on the graph but it is not the most important one. In fact, the red_wyrm (red dragon) puts influence the most in the story. There is only one red dragon in WOW’s world, so the size of the node is really small. However, the edges of it tend to be giant across the world. In actual story, red dragon is truly the most influential character btw. So It proves my previous assumption on how to read the graph.
Graph Theory Analysis on Gephi:
Not only infographic analysis, gephi can also do some very interesting data an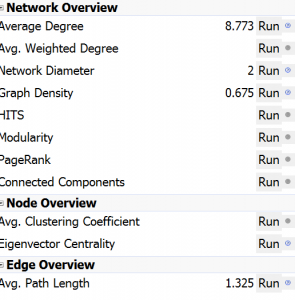 alysis from the graph created. When we talk about graph theory, we are trying to use graph theory to find solution for some statistical consideration on the data. We would like to know about the distribution, shape, and the density. I.e. we would like to know how the characters are connected. Are they connected really tight or not. On the left is the theoretic graph analysis from Gephi. Average Degree is the average influence per character and graph density is how they are connected. From those number the most interesting number is the average path length. From the 6 degree theory, we can predict that in real world social network, the avg. path length ~ 6. However, in WOW, the average path length is 1.32. That means you, as a nobody in that world may connect with our villain in a degree of 2 step. It is really a tight relationship in RPG. In other world we can say, the social status and social barrier is very thin in RPG game’s world.
Compare to Our previous tool: Google Fusion Table and Palladio (Zhengri):
In this section, I would like to say conclusion first: Gephi is much more sophisticated than Google Fusion Table and Palladio because those 2’s feature are only subset of Gephi’s. (Palladio updates from 1.01 to 1.13 and It’s performance is very good now). Google Fusion table and Palladio is easy to use compared to gephi but the thing is things can be done by Google fusion table and palladio can also be done in Gephi but Google fusion table and palladio can not do what Gephi can do. The first feature that they are not able to do is the data managment feature provided by Gephi. Google fusion table and palladio can hardly do database operation like theta join or natural join to the dataset. so that the data scheme can not be added to the data relation. Then, the graphic model of Google fusion table and palladio is insufficient. The only visualization model they can use is force atlas. At last, it is hard for them to do deep data analysis based on graph theory. The comparison between Gephi and them just like the comparison between Photoshop and Windows paint tool. Though they look the same, they live in totally different categories. (Professional productivity tool vs. Temporory tool for fun). They can do simple visualisations but they are not able to do some deep analysis. 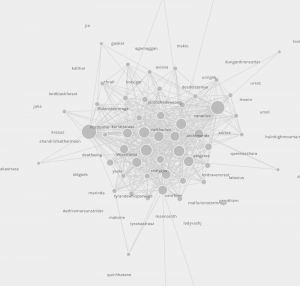
 I should admit that at least they looks very nice.
Leave a Reply