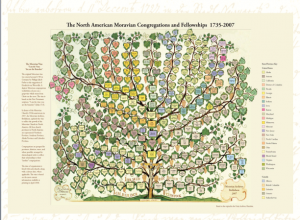
 Data visualization is not a recent phenomenon. For centuries, scholars have represented knowledge in visual form, whether as trees, flow charts, bar charts, memory palaces, pie charts. The dimensions of data visualization reflect also the ideologies and aesthetics of the time. So, for example, where 19th century science tended towards the simplification of information, 21st century knowledge systems embrace complexity.
Class Hours
Class will consist of some slide lectures; some lab hours; some design studios.
In lectures, the instructor will present contextual information and examples, as well as methodological critiques of platforms.
In lab hours, you will be given instruction on how to use the various platforms we will be exploring.
In design studios you will hone your skills in designing visualizations by sketching and producing paper-based prototypes. You will work on analyzing a dataset and creating multiple sketches of visualizations to address the dataset either alone or in teams, depending on the task. Some design studios will require peer critique.
Project
At the core of the course is your project. The goal of the project is to design a web site (WordPress is fine) and interactive visualizations that answer questions you have about some set of humanities data of your own choosing.
You will acquire the data, design your visualizations, implement them, and critically evaluate the results. The path to a good visualization is iterative! It will involve mistakes and wrong turns. And that is fine! It is important to recognize that mistakes are valuable. The project has an intermediate milestone (a snap talk) that will allow you to get feedback.
In your project you will work closely with classmates in 2-3 person project teams. You can come up with your own teams.
Research Questions
One of the crucial steps in designing a data visualization (in all fields) is discerning the relationship between the shape or form of your visualization and the kind of question you are trying to answer. Therefore, when undertaking a visualization project, the following questions must be addressed.
1. What is your research question?
2. Why does this question matter?
3. Can this mode of visualization present a multi-variant analysis?
4. Can you include time as a variant?
5. Does this visualization enrich your critical vocabulary?
6. Does the visualization reveal something new?
7. How does scale change interpretation i.e. macro- vs. micro-analysis (are different things revealed when you zoom in vs. zoom out?)
8. Can your visualization manage intricacy?

Leave a Reply