Brief Introduction to the Project:
Because Zhengri(Albert) Fan and I are big fans on video games, especially RPG (role playing game) video games, we decided to explore video games’ topic changing along with time (time factor) and the relationship between the elements in RPG game. (range factor / relationship factor) So, we collected the introduction texts of all RPG games from 1970s till now in WikiPedia to explore the pattern inside them with Voyant and Jigsaw.
Corpus Construction & How-to:
In order to get all text data from WikiPedia, we read and used WikiPedia Python package: Wikipedia 1.40 Python.Then, we created a list of game with 4055 sets of data (import from RPGGameNameList to be our category.) Using the list as a basis, we pull data from WikiPedia using our python program and put all introduction summary text into one file. After this, we start our visualisation on our corpus but we find 2 major problems: #1: Jigsaw will turn to be really slow and unreliable when processing big amount of data, #2: If we divide the text file into really small pieces, the trend line feature in Voyant can not generate a user-friendly output. So, we use the same corpus and divide it into 2000 pieces for jigsaw to use and a 30 pieces division version is used in Voyant. The final step is junk information processing. Because our text corpus are raw data from online html so there is a lot of junk information that will take very bad influence in our project. We use an algorithm called DedupeFS to solve the problem.
Voyant Analysis on Relationship/Bad Example:
At the beginning of this analysis, I would like to show my readers about an unsuccessful data visualisation I built through out the process, which reflects Shneiderman’s idea about visualisations with occlusion of data and disorientation.

I tried to use Voyant’s Relationship Map Feature to create a visualisation of different RPG game types/forms. That is strategy/tactical and action. After a lot of effort on deleting junk information like not significant time and phrase, I got a relational map on three categories. They are weakly connected with a few words that can tell very very few facts, which is able to be considered as “truth can be reassembled from a different point of view with different emphases and priorities” (Tanya). And this meaningless visualisation makes people feel pretty disoriented because of its wrong presenting style. I put this example here just to clarify that textual analysis with distance reading is not able to work and create very fantastic result every time every where. Sometime, with the limitation of data and visualise method, we got embarrassing results like Tanya’s text says.
Voyant Analysis: Relationship/Fantastic Example (Jiayu Huang Research Part<Mostly>):
But As a proud computer scientist researcher, I discovered my mistake very fast and I changed my visualisation direction into the relationship between different elements instead of topics/genres to find out the spacial/relational significants in this big text data(I mean it is really big, more than 100000 lines of texts). So here is the output:

Starting with the popular term: Dragon, I put lots of core characters or popular terms in Voyant’s network analysis tool to explore their connectivity. Connections between them give me some really exciting results that can be considered as “different angles outputing new stuff. The first fun fact is that I find RPG games love VILLAINS. Demon, Dragon and Monsters looks a lot bigger than heroes or warriors. Quests are the core connections between those elements, which is the absolute centre. Positive fantasy figures such as God, knight and Angel is rarely connected with “everyone”. Ironically, Knight connects to princess with “books”. Does that mean even in our fantasy RPG world, knight and princess can only be together in books? Then Angel connects to our main network with, eh, dungeon. Then, another fun fact is that RPG designed specifically for male and no one cares about love at all. So, take a look at “boy” and “heroine”. Boy connects with named while heroine connecting unnamed. Around princess, there are things like “crown”, “kingdom” and “assistant”. Woman in RPG game is only a thing. There is only objectified female figure in RPG gaming, which surprised me a lot. It is really sad conclusion after I find this. Poor unnamed heroines, more over, can not even connect to the main graph.
Voyant Analysis: TimeLine Analysis (Jiayu Huang Research Part<Mostly>):
Though It is a great success for me to do the relationship map for elements in RPG game, I still want to explore the time’s influence on the popularity of genre. So, I use trend line tool to generate graphs on strategy, tactical and action. Though It is still limited to its inputs (only 3 genre in RPG game to be inspected) It still provides more interesting result than that unsuccessful one. So this is time vs. word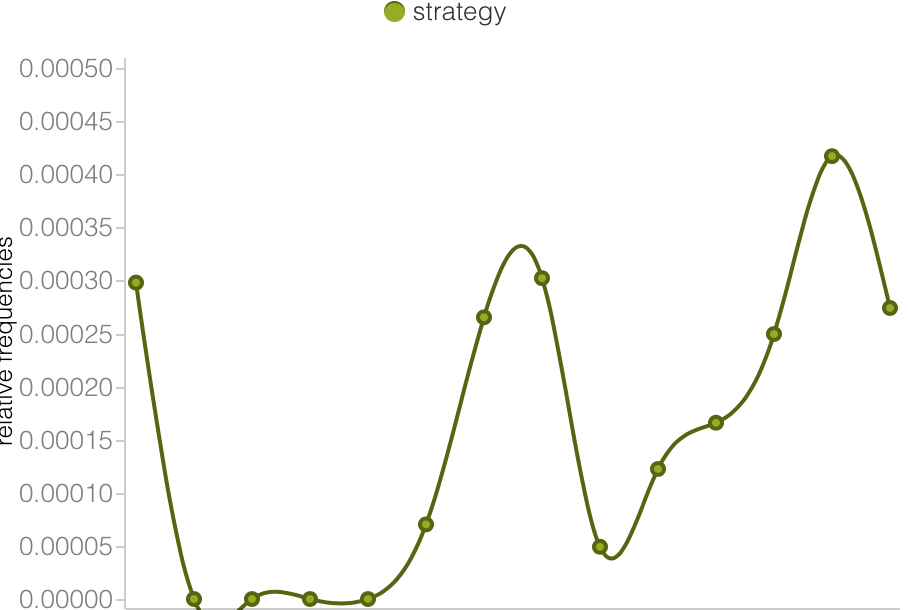
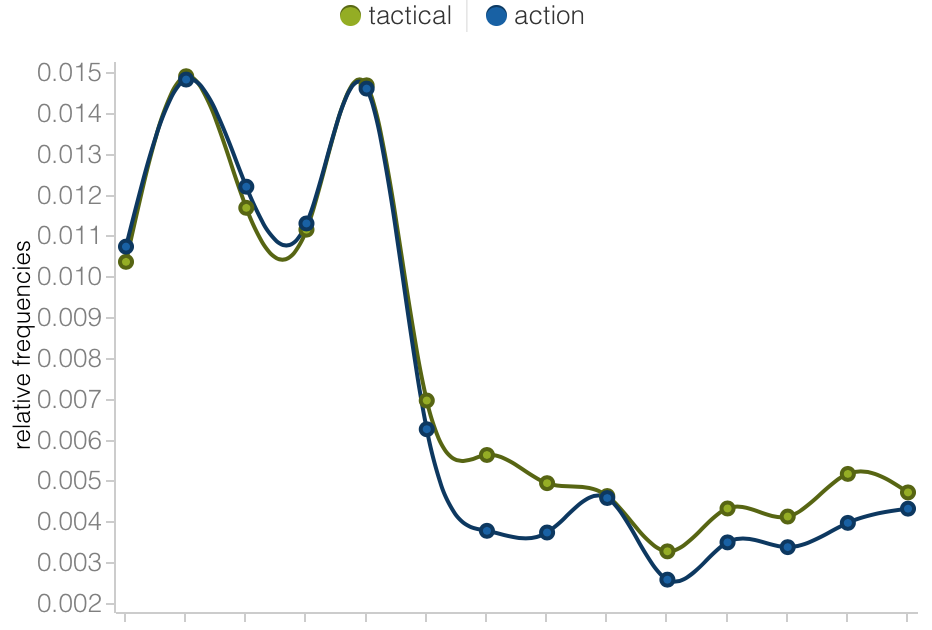
frequencies of different categories. we can see a pattern that tactical is kind of connected with action but strategy acts in a relatively solitude pattern. And It has a very clear inverse correlation between the popularity of strategy games and action/tactical games. It might be a good factor to research anti-intellectualism(especially in this country). Then, I explore war and love’s appearance in RPG gaming through out the time. It gives me a very similar pattern compared with Google ngram’s word frequency visualisation. 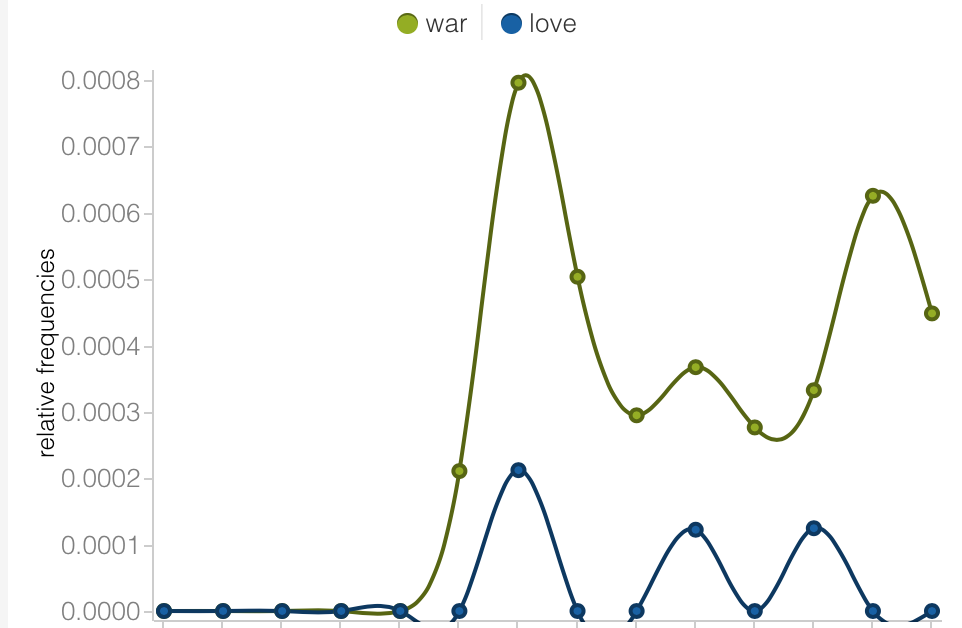 That is: War always coms with love. Though we are saying: Make Love Not War, we only emphasise love when we have war.
Jigsaw Analysis & Jigsaw vs. Voyant (Zhengri Fan Research Part<Jigsaw>):
Both Jigsaw and Voyant are based on Java, but Jigsaw tends to be a smarter one while Voyant creates prettier information graph. One of the coolest feature in Jigsaw is the entity system. Jigsaw is able to categorise entities in a very clever way. It must involve with a lot of machine learning algorithms. Though It is really fancy but for our project, It only provides some generally known facts. Because our data is in WikiPedia and we know the history of Game industry pretty well. 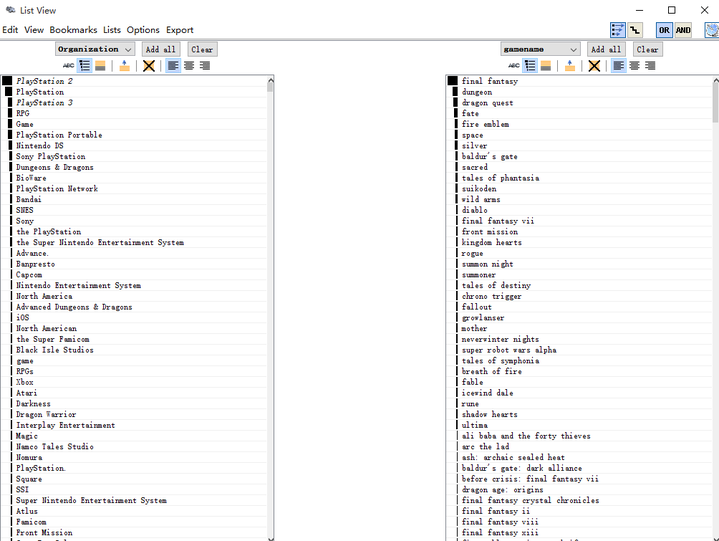 for example, the sony game platforms rule the list of organisations with Play Station, 2 and 3. In another side, final fantasy is the most well-knowned game name. Although, we are very impressed by what it did, It is kind of not very useful in this specifically project. I still want to introduce this feature because I love this cool feature a lot and I can see its potential if it is used for a completely unfamiliar text. The automatic categorise and analysis will save a researcher’s live. Then, another cool part I would like to show is the word tree. It provides me a better sketch/ prove of my previous visualisation discover: Women are objectified thing in RPG video games.
 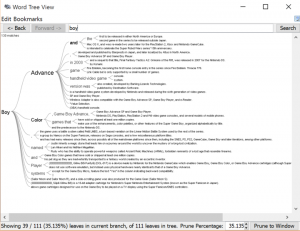 Compared to the phase “Boy”, “Princess” has a much less complexity in the view of word tree. The screenshots’ resolution are not good so left is princess and right is Boy. What makes this complexity diff
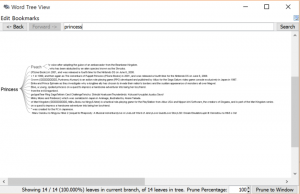 erence should be the stereotyped backgrounding and scripting on woman figure. Jigsaw re-emphasizes the fact. It is hard for me to choose one tool to use in my visualisation project but I will say they have different strength. Voyant is good for exploring relationship and word frequency. Jigsaw with a better algorithm but not quite fancy design are good for doing things on entity categorising and deep language word analysis.
Reflections & Connection:
From this project, I would like to say, two tools reflects two factors in Tanya’s concept: differential reading. While Voyant focuses more on the distance, Jigsaw focuses more on depth (close reading side/ not quite but as a relatively deeper approach). Different set of data or i.e. different angles we interpret data needs different ways to make them not meaningless or means too shallow. The bad example is meaningless visualisation and Jigsaw entity analysis talked about a very superficial story. It is not because the tool is not powerful or data is not good, just because some times we’d have to choose and do more complex research to view the data is different angle to find the right position for presenting data. The process comes with very user friendly out put at last. however, the path toward this approach is really hard/un-user friendly.
Leave a Reply