
Week One –August 24-28
Monday
- Introduction to course, expectations
- What is data visualization? What is it not?
- Visit http://viz.wtf/
- Select two visualizations to discuss on Wednesday

Wednesday
- What is Data Viz for/in Digital Humanities?
- Example of Data Viz
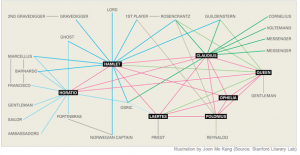
- http://blog.quantifyingkissinger.com/
http://www.quantifyingkissinger.com/KTKA-intertwined-large.jpg - Read/Discuss Elijah Meeks, Digital Humanities as Thunderdome
Friday
- WordPress setup
- More Dataviz for DH examples
- Weekend Reading: Stefan Sinclair et al, Information Visualization for Humanities Scholars
- Practice blog post–quick write up of two examples of bad data viz and two screenshots. File under category “practice”
Week Two — August 31-Sept 4
Monday
- Discussion of Reading: Sinclair
- Examination of Digital Humanities Sample Book
- Read Lima, Chapter 1, “The Tree of Life” by Wednesday.
Wednesday
- Discussion of Lima, Chapter 1
- The ethics of dataviz–the question of human experience
- Holocaust Geographies Collaborative—-when mapping becomes more than spatial.
- The aesthetics of dataviz-Windmap—-http://hint.fm/wind/
Friday
- A Typology of Data Viz: Examination of knowledge structures presented as trees; graphs; clouds (visit to Samek Gallery)
- Assignment 1: due Monday 8am on the website
- Read Lima, Chapter 2 “From Trees to Networks”
Week Three — September 7-11
Monday
- Lab: Voyant 2.0; set up
- (Stefan Sinclair’s Workshop Instructions)
- Google Drive –sample .txt files for analysis
Wednesday
- Creating raw text files
- Metadata/data/interpretation
- Voyant Lab
Friday
- Voyant Lab, cont.
- Discussions and Reading for Monday:
- Over the weekend, work on preparing your corpus and start reading through the Instructions for Jigsaw. Download the software, if you can.
Week Four — September 14-18
Monday
- Platforms for Data Viz: the problem with intention
- Discussion of Tanya Clement
Wednesday
- Lab: learning Jigsaw
- The origins of the algorithm–what happens when the data viz designer comes from a quantitative background and not qualitative? (security, business, science, statistics, geo-physical)
Friday
- Jigsaw lab
- Skype session with lead developer. Dr. John Stasko, Georgia Tech
Week Five — September 21-25
Monday
- Final Jigsaw session
- Due Wednesday by 10 pm
- Assignment 2: Using the same dataset, present a data viz in different platforms using Jigsaw, Voyant (write blog post).
- Read Lima Chapter 3 “Decoding Networks”
Wednesday
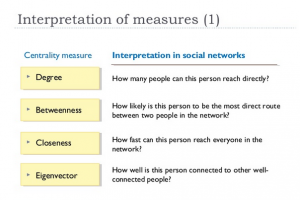
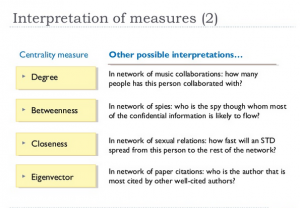
- The Syntax of DataViz: How do we code and decode networks?
- Discuss Lima
- Mapping the Republic of Letters
Friday
- Lab: learning Palladio
- Class Outline
- Miriam Posner’s tutorial
- For Monday, read Drucker (and Faull)
- Explore new releases in DH
Week Six September 28-Oct. 2
Monday
- Discussion of Drucker
- Use pre-prepared structured data (Cushman Collection from M. Posner)
- Compare with Google Fusion Tables
- Palladio lab
Wednesday
- Examination of Humanities Data sets–Alan Liu’s collection
- Palladio lab
- Preparing structured data in a .csv file
- Read Scott Weingart on networks
Friday
- Palladio lab
- Assignment 3: Visualize a set of literary/cultural relations
- For Monday, read Lima Chapter 4 “Infinite Interconnectedness”

Week Seven October 5-9
Monday
- Discussion of Lima, Chapter 4
- Guest Skype session with Scott Weingart, Carnegie Mellon U, Network Visualization
- Exploration of datasets
Wednesday
- The importance of narrative in Data Viz–see Edge Maps
- Examples of Cultural Heritage and Digital Inquiry
- Reading Segel and Heer, “Narrative Visualization”
- Guest artist at Samek Gallery R. Luke DuBois (Oct. 7, 7pm) Required
Friday
- Exploration and creation of datasets
- Discussion of Segel and Heer
- Reading for Wednesday, Lima Chapter 5 “The Syntax of a New Language”
Week Eight (FALL BREAK)
October 14-16
Wednesday
- Databases for the Humanities–cont.
- Discussion of Lima, Chapter 5
Friday
- Visualcomplexity.com
- Syntax of New Language?
Assignment 4: Design Critique-Networks
————-

Week Nine October 19-23
Monday
- Lab: Network visualization with Gephi
- Instructions for Gephi (using their preloaded file)
- Instructions for Visualizing your Facebook data
- Should I use networks for my data?

Wednesday
- Creating datasets in and for Gephi
- Guest speaker, Prof. Jordi Comas, School of Management
Friday
- Lab Gephi
- Read Elijah Meeks’ blog;
 Week Ten October 26-30
Monday
- Lab Gephi, preparing data, cont.
Wednesday
Gephi
Friday
Week Eleven November 2-6
Monday — Final Gephi session
Wednesday
- Conceptualizing a final project
- Belfast group network–interesting project example
-
- Introducing the Final Project.
- D3 design –is this something you might want to use?
- Omeka/Neatline–is this something you might want to use?
Friday 11/6
(Micki Kaufman talk — lunchtime ACWS 108)
Design Studio
In design studios you will hone your skills in designing visualizations by sketching and producing paper-based prototypes. You will work on analyzing a dataset and creating multiple sketches of visualizations to address the dataset either alone or in teams, depending on the task. Some design studios will require peer critique.
For the final project:
Examples of acceptable datasets:
literary works in a historical period or culture
historical events
networks of authors, artists, thinkers, characters
citation networks
email networks
mapping “influences” of works of art or artists/writers/styles
mapping texts (linguistic analysis)
mapping courses/majors/curricula
Week Twelve November 9-13
Monday 11/9–Design Studio
Wednesday 11/11-Design Studio
Friday 11/13
Snap talks on final projects
Week Thirteen November 16-20
Monday 11/16–Working on Final project
Wednesday 11/18–Working on Final Project
Friday 11/22–Working on Final Project
Week 14/15 November 30-Dec. 7
Here is what to expect for the final four days of class:
Monday November 30
Course evaluations
Final consultations about project presentations
This presentation should act as a milestone for the final project. You don’t have to hand in a final blog post at this point and you don’t have to have your website completely ready. But you should have at least 15 slides to present.
For your project presentation you should have completed your data acquisition. You must also have your data structure ready.
You must have a working visualization prototype. You need not have all your views up and running, and it need not be completely interactive, but the direction and the content must be clear.
Your team will present the progress made since the snap talk. You will have 20 minutes to discuss the project, show the class how you have pursued the research question, demonstrate the interactive visualizations you already have. There will be peer review of your project presentations. There will also be peer assessment of your team members.
Wednesday December 2
project presentations
1.Bobby and Adem–Presidential Debates
2.Jerry and Albert Epic Story
Friday, December 4
4. Diane
Monday December 7
5. Yifu, Jiaming, and Jinbo, Poker face
6. Katie Faull on the Lebenslauf project: Memoirs and DH
Wrap up!
Leave a Reply